

Data on high-dimensional spheres arise frequently in many disciplines either naturally or as a consequence of preliminary processing and can have intricate dependence structure that needs to be understood. We develop exploratory factor analysis of the projected normal distribution to explain the variability in such data using a few easily interpreted latent factors. Our methodology provides maximum likelihood estimates through a novel fast alternating expectation profile conditional maximization algorithm. Results on simulation experiments on a wide range of settings are uniformly excellent. Our methodology provides interpretable and insightful results when applied to tweets with the $\#MeToo$ hashtag in early December 2018, to time-course functional Magnetic Resonance Images of the average pre-teen brain at rest, to characterize handwritten digits, and to gene expression data from cancerous cells in the Cancer Genome Atlas.
相關內容
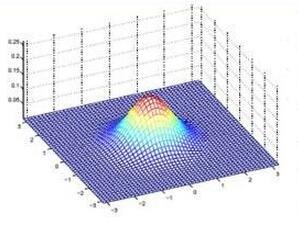
因(yin)子分析(xi)是指研(yan)究從變量群中提取共性因(yin)子的統計技(ji)術(shu)。
The aim of this paper is to describe a novel non-parametric noise reduction technique from the point of view of Bayesian inference that may automatically improve the signal-to-noise ratio of one- and two-dimensional data, such as e.g. astronomical images and spectra. The algorithm iteratively evaluates possible smoothed versions of the data, the smooth models, obtaining an estimation of the underlying signal that is statistically compatible with the noisy measurements. Iterations stop based on the evidence and the $\chi^2$ statistic of the last smooth model, and we compute the expected value of the signal as a weighted average of the whole set of smooth models. In this paper, we explain the mathematical formalism and numerical implementation of the algorithm, and we evaluate its performance in terms of the peak signal to noise ratio, the structural similarity index, and the time payload, using a battery of real astronomical observations. Our Fully Adaptive Bayesian Algorithm for Data Analysis (FABADA) yields results that, without any parameter tuning, are comparable to standard image processing algorithms whose parameters have been optimized based on the true signal to be recovered, something that is impossible in a real application. State-of-the-art non-parametric methods, such as BM3D, offer slightly better performance at high signal-to-noise ratio, while our algorithm is significantly more accurate for extremely noisy data (higher than $20-40\%$ relative errors, a situation of particular interest in the field of astronomy). In this range, the standard deviation of the residuals obtained by our reconstruction may become more than an order of magnitude lower than that of the original measurements. The source code needed to reproduce all the results presented in this report, including the implementation of the method, is publicly available at //github.com/PabloMSanAla/fabada
The analysis of data streams has received considerable attention over the past few decades due to sensors, social media, etc. It aims to recognize patterns in an unordered, infinite, and evolving stream of observations. Clustering this type of data requires some restrictions in time and memory. This paper introduces a new data stream clustering method (IMOC-Stream). This method, unlike the other clustering algorithms, uses two different objective functions to capture different aspects of the data. The goal of IMOC-Stream is to: 1) reduce computation time by using idle times to apply genetic operations and enhance the solution. 2) reduce memory allocation by introducing a new tree synopsis. 3) find arbitrarily shaped clusters by using a multi-objective framework. We conducted an experimental study with high dimensional stream datasets and compared them to well-known stream clustering techniques. The experiments show the ability of our method to partition the data stream in arbitrarily shaped, compact, and well-separated clusters while optimizing the time and memory. Our method also outperformed most of the stream algorithms in terms of NMI and ARAND measures.
The Fr\'{e}chet distance is a well-studied similarity measure between curves that is widely used throughout computer science. Motivated by applications where curves stem from paths and walks on an underlying graph (such as a road network), we define and study the Fr\'{e}chet distance for paths and walks on graphs. When provided with a distance oracle of $G$ with $O(1)$ query time, the classical quadratic-time dynamic program can compute the Fr\'{e}chet distance between two walks $P$ and $Q$ in a graph $G$ in $O(|P| \cdot |Q|)$ time. We show that there are situations where the graph structure helps with computing Fr\'{e}chet distance: when the graph $G$ is planar, we apply existing (approximate) distance oracles to compute a $(1+\varepsilon)$-approximation of the Fr\'{e}chet distance between any shortest path $P$ and any walk $Q$ in $O(|G| \log |G| / \sqrt{\varepsilon} + |P| + \frac{|Q|}{\varepsilon } )$ time. We generalise this result to near-shortest paths, i.e. $\kappa$-straight paths, as we show how to compute a $(1+\varepsilon)$-approximation between a $\kappa$-straight path $P$ and any walk $Q$ in $O(|G| \log |G| / \sqrt{\varepsilon} + |P| + \frac{\kappa|Q|}{\varepsilon } )$ time. Our algorithmic results hold for both the strong and the weak discrete Fr\'{e}chet distance over the shortest path metric in $G$. Finally, we show that additional assumptions on the input, such as our assumption on path straightness, are indeed necessary to obtain truly subquadratic running time. We provide a conditional lower bound showing that the Fr\'{e}chet distance, or even its $1.01$-approximation, between arbitrary \emph{paths} in a weighted planar graph cannot be computed in $O((|P|\cdot|Q|)^{1-\delta})$ time for any $\delta > 0$ unless the Orthogonal Vector Hypothesis fails. For walks, this lower bound holds even when $G$ is planar, unit-weight and has $O(1)$ vertices.
The widespread availability of high-dimensional biological data has made the simultaneous screening of many biological characteristics a central problem in computational biology and allied sciences. While the dimensionality of such datasets continues to grow, so too does the complexity of biomarker identification from exposure patterns in health studies measuring baseline confounders; moreover, doing so while avoiding model misspecification remains an issue only partially addressed. Efficient estimators capable of incorporating flexible, data adaptive regression techniques in estimating relevant components of the data-generating distribution provide an avenue for avoiding model misspecification; however, in the context of high-dimensional problems that require the simultaneous estimation of numerous parameters, standard variance estimators have proven unstable, resulting in unreliable Type-I error control even under standard multiple testing corrections. We present a general approach for applying empirical Bayes shrinkage to variance estimators of a family of efficient, asymptotically linear estimators of population intervention causal effects. Our generalization of shrinkage-based variance estimators increases inferential stability in high-dimensional settings, facilitating the application of these estimators for deriving nonparametric variable importance measures in high-dimensional biological datasets with modest sample sizes. The result is a data adaptive approach for robustly uncovering stable causal associations in high-dimensional data in studies with limited samples. Our generalized variance estimator is evaluated against alternative variance estimators in numerical experiments. Identification of biomarkers with the proposed methodology is demonstrated in an analysis of high-dimensional DNA methylation data from an observational study on the epigenetic effects of tobacco smoking.
This paper devises a novel lowest-order conforming virtual element method (VEM) for planar linear elasticity with the pure displacement/traction boundary condition. The main trick is to view a generic polygon $K$ as a new one $\widetilde{K}$ with additional vertices consisting of interior points on edges of $K$, so that the discrete admissible space is taken as the $V_1$ type virtual element space related to the partition $\{\widetilde{K}\}$ instead of $\{K\}$. The method is shown to be uniformly convergent with the optimal rates both in $H^1$ and $L^2$ norms with respect to the Lam\'{e} constant $\lambda$. Numerical tests are presented to illustrate the good performance of the proposed VEM and confirm the theoretical results.
The methodological development of this paper is motivated by the need to address the following scientific question: does the issuance of heat alerts prevent adverse health effects? Our goal is to address this question within a causal inference framework in the context of time series data. A key challenge is that causal inference methods require the overlap assumption to hold: each unit (i.e., a day) must have a positive probability of receiving the treatment (i.e., issuing a heat alert on that day). In our motivating example, the overlap assumption is often violated: the probability of issuing a heat alert on a cool day is zero. To overcome this challenge, we propose a stochastic intervention for time series data which is implemented via an incremental time-varying propensity score (ItvPS). The ItvPS intervention is executed by multiplying the probability of issuing a heat alert on day $t$ -- conditional on past information up to day $t$ -- by an odds ratio $\delta_t$. First, we introduce a new class of causal estimands that relies on the ItvPS intervention. We provide theoretical results to show that these causal estimands can be identified and estimated under a weaker version of the overlap assumption. Second, we propose nonparametric estimators based on the ItvPS and derive an upper bound for the variances of these estimators. Third, we extend this framework to multi-site time series using a meta-analysis approach. Fourth, we show that the proposed estimators perform well in terms of bias and root mean squared error via simulations. Finally, we apply our proposed approach to estimate the causal effects of increasing the probability of issuing heat alerts on each warm-season day in reducing deaths and hospitalizations among Medicare enrollees in $2,837$ U.S. counties.
Analyzing large-scale data from simulations of turbulent flows is memory intensive, requiring significant resources. This major challenge highlights the need for data compression techniques. In this study, we apply a physics-informed Deep Learning technique based on vector quantization to generate a discrete, low-dimensional representation of data from simulations of three-dimensional turbulent flows. The deep learning framework is composed of convolutional layers and incorporates physical constraints on the flow, such as preserving incompressibility and global statistical characteristics of the velocity gradients. The accuracy of the model is assessed using statistical, comparison-based similarity and physics-based metrics. The training data set is produced from Direct Numerical Simulation of an incompressible, statistically stationary, isotropic turbulent flow. The performance of this lossy data compression scheme is evaluated not only with unseen data from the stationary, isotropic turbulent flow, but also with data from decaying isotropic turbulence, and a Taylor-Green vortex flow. Defining the compression ratio (CR) as the ratio of original data size to the compressed one, the results show that our model based on vector quantization can offer CR $=85$ with a mean square error (MSE) of $O(10^{-3})$, and predictions that faithfully reproduce the statistics of the flow, except at the very smallest scales where there is some loss. Compared to the recent study based on a conventional autoencoder where compression is performed in a continuous space, our model improves the CR by more than $30$ percent, and reduces the MSE by an order of magnitude. Our compression model is an attractive solution for situations where fast, high quality and low-overhead encoding and decoding of large data are required.
There have been many attempts to solve the P versus NP problem. However, with a new proof method, P not equal NP can be proved. A time limit is set for an arbitrary Turing machine and an input word is rejected on a timeout. The time limit goes toward infinity. Due to the halting problem, whether a word is accepted can only be determined at runtime. It can be shown by Rice's theorem, if a finite set of words are to be checked, they all have to be tested by brute force.
The popularity of Bayesian statistical methods has increased dramatically in recent years across many research areas and industrial applications. This is the result of a variety of methodological advances with faster and cheaper hardware as well as the development of new software tools. Here we introduce an open source Python package named Bambi (BAyesian Model Building Interface) that is built on top of the PyMC probabilistic programming framework and the ArviZ package for exploratory analysis of Bayesian models. Bambi makes it easy to specify complex generalized linear hierarchical models using a formula notation similar to those found in R. We demonstrate Bambi's versatility and ease of use with a few examples spanning a range of common statistical models including multiple regression, logistic regression, and mixed-effects modeling with crossed group specific effects. Additionally we discuss how automatic priors are constructed. Finally, we conclude with a discussion of our plans for the future development of Bambi.
Optimal pricing, i.e., determining the price level that maximizes profit or revenue of a given product, is a vital task for the retail industry. To select such a quantity, one needs first to estimate the price elasticity from the product demand. Regression methods usually fail to recover such elasticities due to confounding effects and price endogeneity. Therefore, randomized experiments are typically required. However, elasticities can be highly heterogeneous depending on the location of stores, for example. As the randomization frequently occurs at the municipal level, standard difference-in-differences methods may also fail. Possible solutions are based on methodologies to measure the effects of treatments on a single (or just a few) treated unit(s) based on counterfactuals constructed from artificial controls. For example, for each city in the treatment group, a counterfactual may be constructed from the untreated locations. In this paper, we apply a novel high-dimensional statistical method to measure the effects of price changes on daily sales from a major retailer in Brazil. The proposed methodology combines principal components (factors) and sparse regressions, resulting in a method called Factor-Adjusted Regularized Method for Treatment evaluation (\texttt{FarmTreat}). The data consist of daily sales and prices of five different products over more than 400 municipalities. The products considered belong to the \emph{sweet and candies} category and experiments have been conducted over the years of 2016 and 2017. Our results confirm the hypothesis of a high degree of heterogeneity yielding very different pricing strategies over distinct municipalities.
小貼士
登錄享


注冊地址: 北京市海淀區羊坊店路18號2幢3層301-191