
The rapid advancement of models based on artificial intelligence demands innovative monitoring techniques which can operate in real time with low computational costs. In machine learning, especially if we consider artificial neural networks (ANNs), the models are often trained in a supervised manner. Consequently, the learned relationship between the input and the output must remain valid during the model's deployment. If this stationarity assumption holds, we can conclude that the ANN provides accurate predictions. Otherwise, the retraining or rebuilding of the model is required. We propose considering the latent feature representation of the data (called "embedding") generated by the ANN to determine the time when the data stream starts being nonstationary. In particular, we monitor embeddings by applying multivariate control charts based on the data depth calculation and normalized ranks. The performance of the introduced method is compared with benchmark approaches for various ANN architectures and different underlying data formats.
相關內容
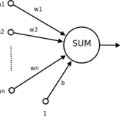
人工神經網絡(Artificial Neural Network,即ANN),它從信息處理角度對人腦神經元網絡進行抽象,建立某種簡單模型,按不同的連接方式組成不同的網絡。在工程與學術界也常直接簡稱為神經網絡或類神經網絡。神經網絡是一種運算模型,由大量的節點(或稱神經元)之間相互聯接構成。每個節點代表一種特定的輸出函數,稱為激勵函數(activation function)。每兩個節點間的連接都代表一個對于通過該連接信號的加權值,稱之為權重,這相當于人工神經網絡的記憶。網絡的輸出則依網絡的連接方式,權重值和激勵函數的不同而不同。而網絡自身通常都是對自然界某種算法或者函數的逼近,也可能是對一種邏輯策略的表達。
We investigate the dynamics of chemical reaction networks (CRNs) with the goal of deriving an upper bound on their reaction rates. This task is challenging due to the nonlinear nature and discrete structure inherent in CRNs. To address this, we employ an information geometric approach, using the natural gradient, to develop a nonlinear system that yields an upper bound for CRN dynamics. We validate our approach through numerical simulations, demonstrating faster convergence in a specific class of CRNs. This class is characterized by the number of chemicals, the maximum value of stoichiometric coefficients of the chemical reactions, and the number of reactions. We also compare our method to a conventional approach, showing that the latter cannot provide an upper bound on reaction rates of CRNs. While our study focuses on CRNs, the ubiquity of hypergraphs in fields from natural sciences to engineering suggests that our method may find broader applications, including in information science.
Loss reserving generally focuses on identifying a single model that can generate superior predictive performance. However, different loss reserving models specialise in capturing different aspects of loss data. This is recognised in practice in the sense that results from different models are often considered, and sometimes combined. For instance, actuaries may take a weighted average of the prediction outcomes from various loss reserving models, often based on subjective assessments. In this paper, we propose a systematic framework to objectively combine (i.e. ensemble) multiple _stochastic_ loss reserving models such that the strengths offered by different models can be utilised effectively. Our framework contains two main innovations compared to existing literature and practice. Firstly, our criteria model combination considers the full distributional properties of the ensemble and not just the central estimate - which is of particular importance in the reserving context. Secondly, our framework is that it is tailored for the features inherent to reserving data. These include, for instance, accident, development, calendar, and claim maturity effects. Crucially, the relative importance and scarcity of data across accident periods renders the problem distinct from the traditional ensembling techniques in statistical learning. Our framework is illustrated with a complex synthetic dataset. In the results, the optimised ensemble outperforms both (i) traditional model selection strategies, and (ii) an equally weighted ensemble. In particular, the improvement occurs not only with central estimates but also relevant quantiles, such as the 75th percentile of reserves (typically of interest to both insurers and regulators).
Some early color photographic processes based on special color screen filters pose specific challenges in their digitization and digital presentation. Those challenges include dynamic range, resolution, and the difficulty of stitching geometrically-repeating patterns. We describe a novel method used to digitize the collection of early color photographs at the National Geographic Society which makes use of a custom open-source software tool to analyze and precisely stitch regular color screen processes.
We present a model reduction approach that extends the original empirical interpolation method to enable accurate and efficient reduced basis approximation of parametrized nonlinear partial differential equations (PDEs). In the presence of nonlinearity, the Galerkin reduced basis approximation remains computationally expensive due to the high complexity of evaluating the nonlinear terms, which depends on the dimension of the truth approximation. The empirical interpolation method (EIM) was proposed as a nonlinear model reduction technique to render the complexity of evaluating the nonlinear terms independent of the dimension of the truth approximation. We introduce a first-order empirical interpolation method (FOEIM) that makes use of the partial derivative information to construct an inexpensive and stable interpolation of the nonlinear terms. We propose two different FOEIM algorithms to generate interpolation points and basis functions. We apply the FOEIM to nonlinear elliptic PDEs and compare it to the Galerkin reduced basis approximation and the EIM. Numerical results are presented to demonstrate the performance of the three reduced basis approaches.
Background: As available medical image datasets increase in size, it becomes infeasible for clinicians to review content manually for knowledge extraction. The objective of this study was to create an automated clustering resulting in human-interpretable pattern discovery. Methods: Images from the public HAM10000 dataset, including 7 common pigmented skin lesion diagnoses, were tiled into 29420 tiles and clustered via k-means using neural network-extracted image features. The final number of clusters per diagnosis was chosen by either the elbow method or a compactness metric balancing intra-lesion variance and cluster numbers. The amount of resulting non-informative clusters, defined as those containing less than six image tiles, was compared between the two methods. Results: Applying k-means, the optimal elbow cutoff resulted in a mean of 24.7 (95%-CI: 16.4-33) clusters for every included diagnosis, including 14.9% (95% CI: 0.8-29.0) non-informative clusters. The optimal cutoff, as estimated by the compactness metric, resulted in significantly fewer clusters (13.4; 95%-CI 11.8-15.1; p=0.03) and less non-informative ones (7.5%; 95% CI: 0-19.5; p=0.017). The majority of clusters (93.6%) from the compactness metric could be manually mapped to previously described dermatoscopic diagnostic patterns. Conclusions: Automatically constraining unsupervised clustering can produce an automated extraction of diagnostically relevant and human-interpretable clusters of visual patterns from a large image dataset.
A change point detection (CPD) framework assisted by a predictive machine learning model called "Predict and Compare" is introduced and characterised in relation to other state-of-the-art online CPD routines which it outperforms in terms of false positive rate and out-of-control average run length. The method's focus is on improving standard methods from sequential analysis such as the CUSUM rule in terms of these quality measures. This is achieved by replacing typically used trend estimation functionals such as the running mean with more sophisticated predictive models (Predict step), and comparing their prognosis with actual data (Compare step). The two models used in the Predict step are the ARIMA model and the LSTM recursive neural network. However, the framework is formulated in general terms, so as to allow the use of other prediction or comparison methods than those tested here. The power of the method is demonstrated in a tribological case study in which change points separating the run-in, steady-state, and divergent wear phases are detected in the regime of very few false positives.
Optimal transport and Wasserstein distances are flourishing in many scientific fields as a means for comparing and connecting random structures. Here we pioneer the use of an optimal transport distance between L\'{e}vy measures to solve a statistical problem. Dependent Bayesian nonparametric models provide flexible inference on distinct, yet related, groups of observations. Each component of a vector of random measures models a group of exchangeable observations, while their dependence regulates the borrowing of information across groups. We derive the first statistical index of dependence in $[0,1]$ for (completely) random measures that accounts for their whole infinite-dimensional distribution, which is assumed to be equal across different groups. This is accomplished by using the geometric properties of the Wasserstein distance to solve a max-min problem at the level of the underlying L\'{e}vy measures. The Wasserstein index of dependence sheds light on the models' deep structure and has desirable properties: (i) it is $0$ if and only if the random measures are independent; (ii) it is $1$ if and only if the random measures are completely dependent; (iii) it simultaneously quantifies the dependence of $d \ge 2$ random measures, avoiding the need for pairwise comparisons; (iv) it can be evaluated numerically. Moreover, the index allows for informed prior specifications and fair model comparisons for Bayesian nonparametric models.
In large-scale systems there are fundamental challenges when centralised techniques are used for task allocation. The number of interactions is limited by resource constraints such as on computation, storage, and network communication. We can increase scalability by implementing the system as a distributed task-allocation system, sharing tasks across many agents. However, this also increases the resource cost of communications and synchronisation, and is difficult to scale. In this paper we present four algorithms to solve these problems. The combination of these algorithms enable each agent to improve their task allocation strategy through reinforcement learning, while changing how much they explore the system in response to how optimal they believe their current strategy is, given their past experience. We focus on distributed agent systems where the agents' behaviours are constrained by resource usage limits, limiting agents to local rather than system-wide knowledge. We evaluate these algorithms in a simulated environment where agents are given a task composed of multiple subtasks that must be allocated to other agents with differing capabilities, to then carry out those tasks. We also simulate real-life system effects such as networking instability. Our solution is shown to solve the task allocation problem to 6.7% of the theoretical optimal within the system configurations considered. It provides 5x better performance recovery over no-knowledge retention approaches when system connectivity is impacted, and is tested against systems up to 100 agents with less than a 9% impact on the algorithms' performance.
Nowadays, the Convolutional Neural Networks (CNNs) have achieved impressive performance on many computer vision related tasks, such as object detection, image recognition, image retrieval, etc. These achievements benefit from the CNNs outstanding capability to learn the input features with deep layers of neuron structures and iterative training process. However, these learned features are hard to identify and interpret from a human vision perspective, causing a lack of understanding of the CNNs internal working mechanism. To improve the CNN interpretability, the CNN visualization is well utilized as a qualitative analysis method, which translates the internal features into visually perceptible patterns. And many CNN visualization works have been proposed in the literature to interpret the CNN in perspectives of network structure, operation, and semantic concept. In this paper, we expect to provide a comprehensive survey of several representative CNN visualization methods, including Activation Maximization, Network Inversion, Deconvolutional Neural Networks (DeconvNet), and Network Dissection based visualization. These methods are presented in terms of motivations, algorithms, and experiment results. Based on these visualization methods, we also discuss their practical applications to demonstrate the significance of the CNN interpretability in areas of network design, optimization, security enhancement, etc.

Recent advances in 3D fully convolutional networks (FCN) have made it feasible to produce dense voxel-wise predictions of volumetric images. In this work, we show that a multi-class 3D FCN trained on manually labeled CT scans of several anatomical structures (ranging from the large organs to thin vessels) can achieve competitive segmentation results, while avoiding the need for handcrafting features or training class-specific models. To this end, we propose a two-stage, coarse-to-fine approach that will first use a 3D FCN to roughly define a candidate region, which will then be used as input to a second 3D FCN. This reduces the number of voxels the second FCN has to classify to ~10% and allows it to focus on more detailed segmentation of the organs and vessels. We utilize training and validation sets consisting of 331 clinical CT images and test our models on a completely unseen data collection acquired at a different hospital that includes 150 CT scans, targeting three anatomical organs (liver, spleen, and pancreas). In challenging organs such as the pancreas, our cascaded approach improves the mean Dice score from 68.5 to 82.2%, achieving the highest reported average score on this dataset. We compare with a 2D FCN method on a separate dataset of 240 CT scans with 18 classes and achieve a significantly higher performance in small organs and vessels. Furthermore, we explore fine-tuning our models to different datasets. Our experiments illustrate the promise and robustness of current 3D FCN based semantic segmentation of medical images, achieving state-of-the-art results. Our code and trained models are available for download: //github.com/holgerroth/3Dunet_abdomen_cascade.
小貼士
登錄享


注冊地址: 北京市海淀區羊坊店路18號2幢3層301-191